仕事6時間、パーティ1時間、スポーツ4時間、そして友人・家族との時間は取れるだけ取る
先日紹介した、エリザベス・ダン先生らの最新研究の関連研究。まだ論文にもなっていないものですが。(preprint)
ー
どんな一日を送ると、幸せか。
を前回同様のアメリカ時間利用調査を元に検証頂きました😊
2013年と2021年のデータで検証。
ー
結果としては、
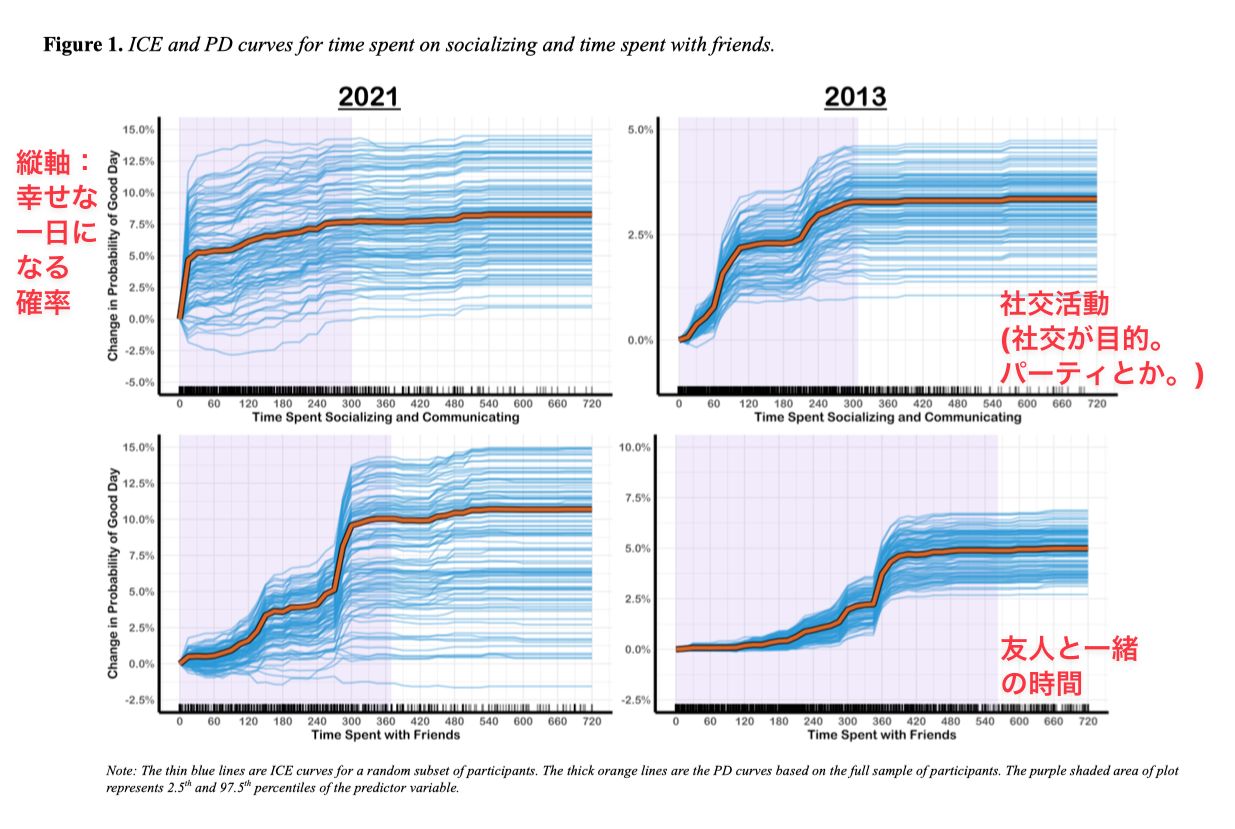
・社交時間は1~2時間までは幸福度向上、それ以降は横ばい。
※社交を主目的とした活動。パーティなど。
・友人との時間は5~6時間まで幸福度急上昇。それ以降も少しずつ向上。
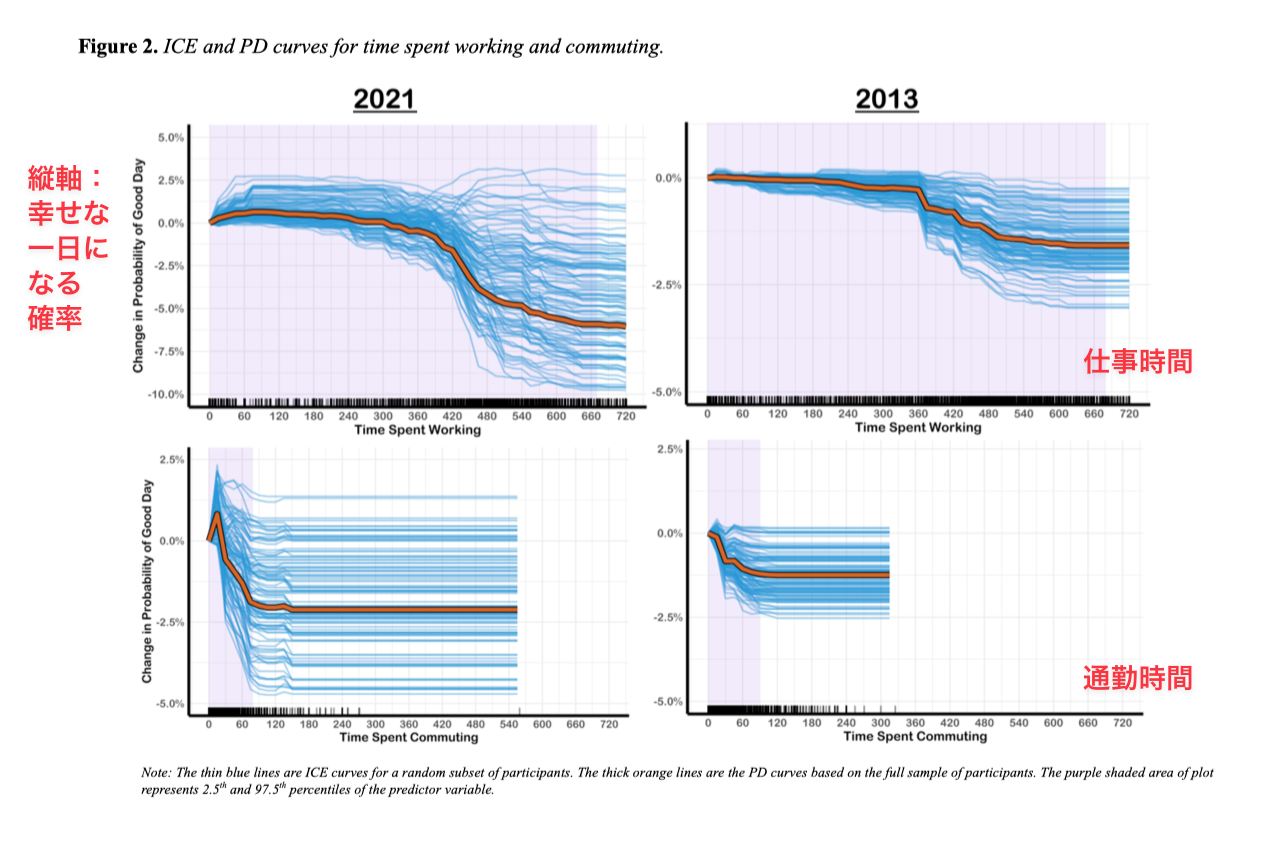
・仕事時間は6時間までは横ばい。6時間を超えてくると、どんどん低下。
⇒意外なことに仕事は6時間までは幸せに影響しなかった。
・通勤時間は
2021年は、15分までは幸福度向上、その後60分まで幸福度低下、以降は横ばい
2013年は、90分まで幸福度低下、以降は横ばい
⇒コロナ禍だったので、通勤が貴重で楽しかったのかな。
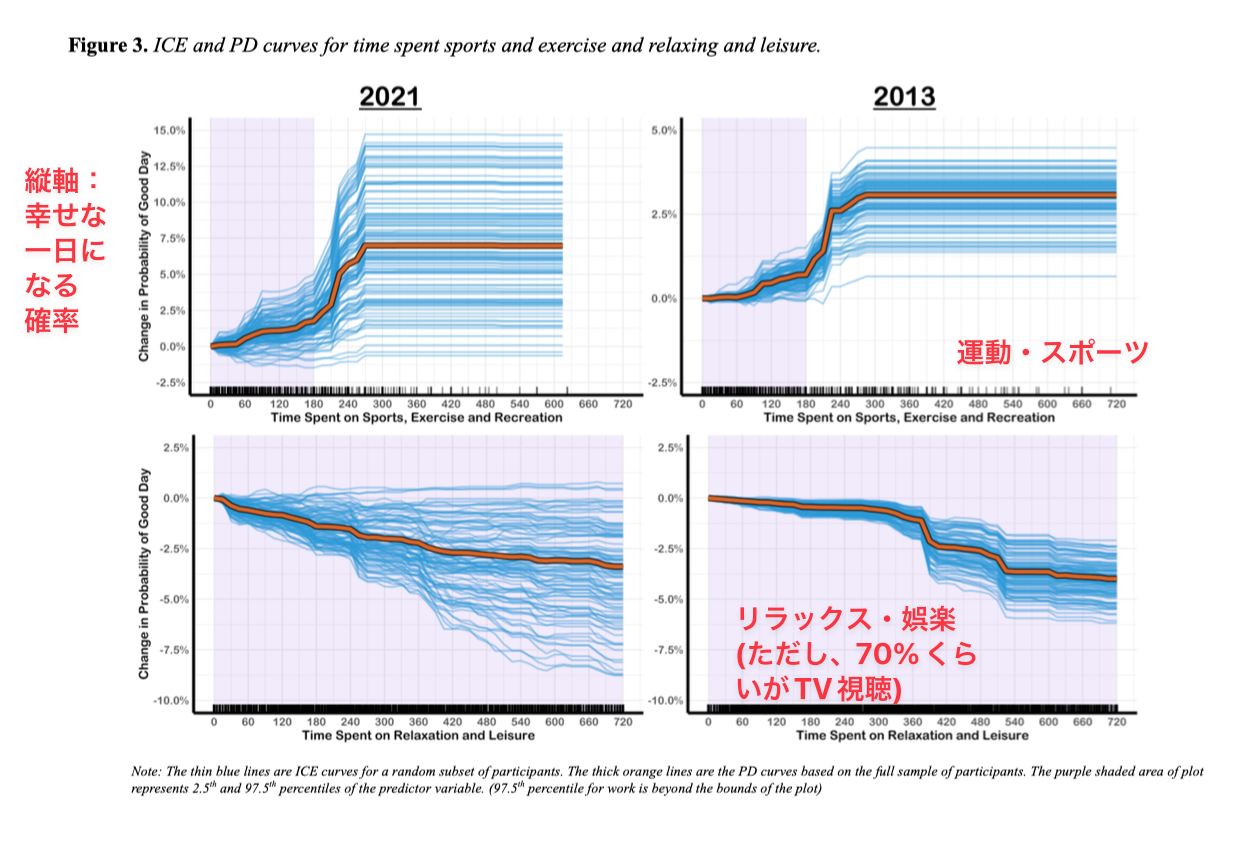
・スポーツ・運動時間は、4時間まで幸福度向上。以降は横ばい。
・娯楽・リラックス時間は、ずっと低下。
⇒ただし、娯楽時間の7割超はTV視聴だった為、TV見る時間が増えると幸福度が落ちる感じですね。
ー
添付のチャートになっていない部分では、
・家族との時間は、友人との時間同様、長い程、幸せ。でした。
・そして、2013年と2021年とだいぶ違う時期が違いますが、ほとんど似たような傾向が出ていた。
というのが脅威的な所。人間って、環境が変わっても、そんなに変わらないものですね。
※2013年はアメリカのスマホ普及率がやっと50%いったくらい。
ー
とのことです。
なので、
社交時間を1時間
通勤時間は15分までにして、仕事は6時間。
友人とスポーツを4時間くらい行う。
それ以外は家族との時間は取れるだけ取る。
というのが、最も幸せな一日となりそうです😊
(日本だと、ちょっと違うかもしれませんが。)
ーーー
良い日とは何なのか?:アメリカ時間利用調査に対する解釈可能な機械学習アプローチ
What Makes a Good Day?: An Interpretable Machine Learning Approach to the American Time Use Survey
Dunigan Folk, Mirka Henninger, and Elizabeth Dunn
2025/2,preprint
https://osf.io/preprints/psyarxiv/zs9t2_v1
幸せな日と普通の日の違いは何でしょうか?この質問に答えることは、幸せな人生の基盤を特定するのに役立ちますが、なぜある日は他の日よりも良いのかについては、まだほとんど分かっていません。良い日の要素を特定するため、私たちは解釈可能な機械学習技術を用いて、100を超える活動に費やした時間が、アメリカ人がその日を「普通」か「普通より良い」と評価するかを予測するかどうかを分析しました。
2013年(N = 9,286)と2021年(N = 6,196)のアメリカ時間利用調査のデータを使用し、良い日と典型的な日を区別する明確な転換点を特定しました。社交活動は良い日を送る上で最も重要な活動の一つでしたが、2時間を超えると追加の社交活動はほとんど影響を与えませんでした。一方、友人との時間はほぼ無限にポジティブな効果をもたらしました。仕事のインパクトも時間依存性が非常に高かったです。6時間までの仕事は、人々がその日を通常より良いと評価するかどうかには影響しませんでした。しかし、6時間を超えると、効果は急速に負に転じました。これらの結果を総合すると、良い日は時間の価値が常に変化する中で生まれることが示唆されます。1日の各分は、利益が減少する転換点とコストが積み上がる転換点を持つ、競合する機会間の選択を表しています。
6 HOURS OF WORK 1 HOUR OF PARTY 4 HOURS OF SPORTS SPENDING TIME WITH FRIENDS AND FAMILY Figure 1. ICE and PD curves for time spent on socializing and time spent with friends. 2021 2013 縦軸: 幸せな一日に なる確率 Change in Probability of Good Day 15.0% 12.5% 10.0% 7.5% 5.0% 2.5% 0.0% -2.5% 0 60 120 180 240 300 360 420 480 540 600 660 720 Time Spent Socializing and Communicating 5.0% 2.5% 0.0% -2.5% 社交活動 (社交が目的。 パーティとか。) Change in Probability of Good Day 15.0% 12.5% 10.0% 7.5% 5.0% 2.5% 0.0% -2.5% 0 60 120 180 240 300 360 420 480 540 600 660 720 Time Spent with Friends 10.0% 7.5% 5.0% 2.5% 0.0% 友人と一緒 の時間 Change in Probability of Good Day 0 60 120 180 240 300 360 420 480 540 600 660 720 Time Spent with Friends Note: The thin blue lines are ICE curves for a random subset of participants. The thick orange lines are the PD curves based on the full sample of participants. The purple shaded area of plots represents 2.5th and 97.5th percentiles of the predictor variable. Figure 2. ICE and PD curves for time spent working and commuting. 2021 2013 縦軸: 仕事時間 幸せな 一日に なる 確率 Change in Probability of Good Day 5.0% 2.5% 0.0% -2.5% -5.0% -7.5% -10.0% 0.0% -2.5% -5.0% 0 60 120 180 240 300 360 420 480 540 600 660 720 Time Spent Working 2.5% 1.5% 0.5% -0.5% -1.5% -2.5% -3.5% -4.5% -5.5% 0 60 120 180 240 300 360 420 480 540 600 660 720 Time Spent Working 2.5% 1.5% 0.5% -0.5% -1.5% -2.5% -3.5% -4.5% -5.5% 0 60 120 180 240 300 360 420 480 540 600 660 720 Time Spent Commuting 通勤時間 2.5% 1.5% 0.5% -0.5% -1.5% -2.5% -3.5% -4.5% -5.5% 0 60 120 180 240 300 360 420 480 540 600 660 720 Time Spent Commuting Note: The thin blue lines are ICE curves for a random subset of participants. The thick orange lines are the PD curves based on the full sample of participants. The purple shaded area of plot represents 2.5th and 97.5th percentiles of the predictor variable. Figure 3. ICE and PD curves for time spent sports and exercise and relaxing and leisure. 2021 2013 縦軸:幸せな一日になる確率 15.0% 12.5% 10.0% 7.5% 5.0% 2.5% 0.0% -2.5% Change in Probability of Good Day 5.0% 2.5% 0.0% -2.5% -5.0% 運動・スポーツ 2.5% 0.0% -2.5% -5.0% -7.5% -10.0% 0 60 120 180 240 300 360 420 480 540 600 660 720 Time Spent on Sports, Exercise and Recreation 0 60 120 180 240 300 360 420 480 540 600 660 720 Time Spent on Sports, Exercise and Recreation リラックス・娯楽(ただし、70%くらいがTV視聴) 0 60 120 180 240 300 360 420 480 540 600 660 720 Time Spent on Relaxation and Leisure 2.5% 0.0% -2.5% -5.0% -7.5% -10.0% 0 60 120 180 240 300 360 420 480 540 600 660 720 Time Spent on Relaxation and Leisure Note: The thin blue lines are ICE curves for a random subset of participants. The thick orange lines are the PD curves based on the full sample of participants. The purple shaded area of plot represents 2.5th and 97.5th percentiles of the predictor variable. (97.5th percentile for work is beyond the bounds of the plot)

本研究のウェルビーイング小話はこちら😊
はぴテク相談室:幸せな一日の送り方
https://wellbeing-archive.pages.dev/posts/2025-08-21-1755813603/